| 1 |
Landuse map of Kaghan Valley
This project has been funded by International Center for Integrated Mountain Development (ICIMOD), Nepal. Kaghan valley situated in the North West Frontier Province of Pakistan has been subjected to rapid modifications in last few years because of increasing developmental activities, decrease in forest cover, and change in land use pattern. It caused serious Geo¬Environmental hazards like landslides. soil erosion, and floods. The main road of the valley remains blocked during summer as well as winter because of heavy landslides. It was an immediate need of developing a landslide hazard zone map for the valley, which would be helpful for the planning infrastructure and settlement in future.
See Map
|
| 2 |
Landslide hazard zonation map
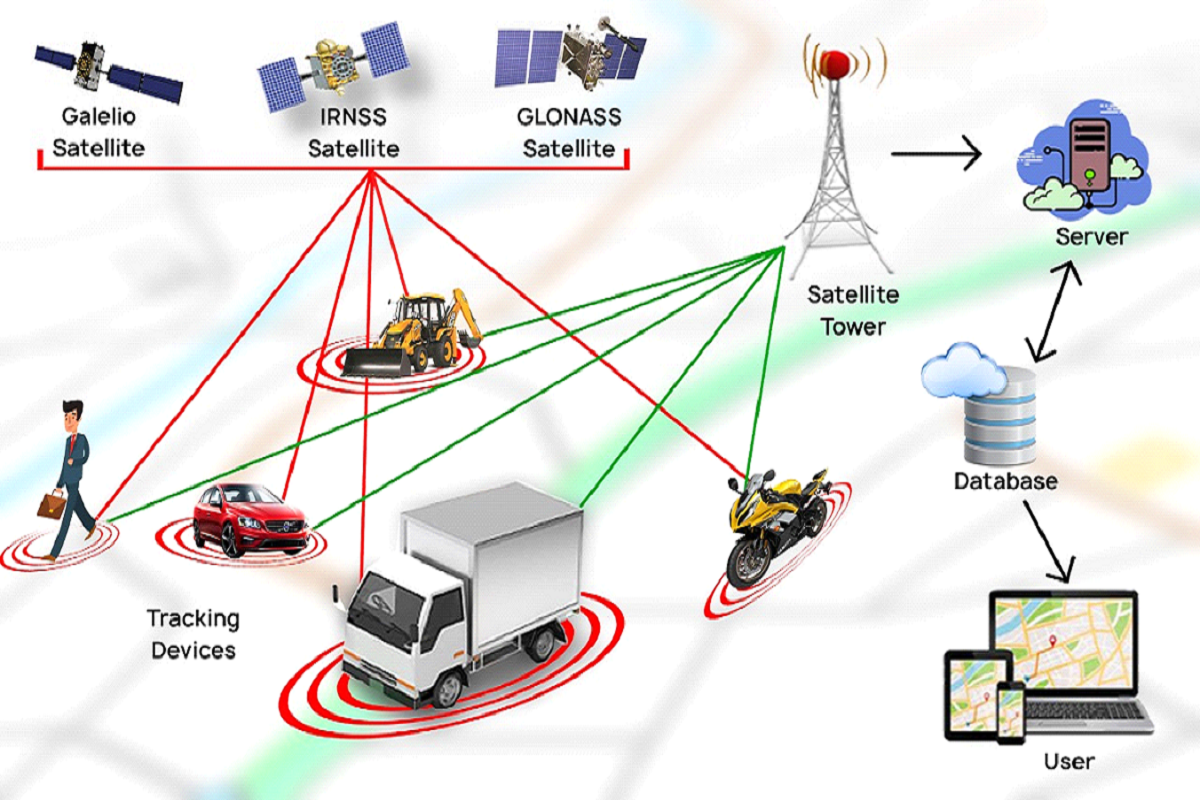
In this project we have developed a landslide hazard map by integration of Global Positioning System (GPS), Geographic Information Systems (GIS) and Remote Sensing. The landslides in area have been located and mapped by using GPS. We have considered nine factors for producing landslide hazards. These factors are land cover, elevation, slope. aspect, soil, geology, rainfall, drainage & road. Land cover map (Fig. 1) has been obtained by processing SPOT satellite data. A Digital Elevation Model (DEM) has been obtained by digitizing and processing a contour map in Arc/Info. Elevation, slope and aspect maps have been obtained from DEM. Soil, geology, road, drainage and rainfall maps were digitized. Buffering of road and drainage maps was conducted to specify some distance around each of these factors.
See Map
|
| 3 |
Suitable alternative road
Pixel-based Information Value Model was used to obtain landslide hazard for the different factors. The purpose of using the information value model was to give the numerical weight to all the factors, which were considered for the landslide hazard analysis. The model helped us to indicate the most causative factors for the landslide occurrence. The lower information values obtained from model mean low landslide hazard where as higher values mean the higher landslide hazard. Based on these values. we generated a landslide hazard map with five-landslide hazard zones ranging from very low to very high hazard (Fig. 2). This map shows that the current main road of the valley is in the zone of high or very high hazard (Fig. 2). By using this map, two new road routes are digitized for the construction of main road (Fig. 3). These routes are either in less or very less hazard zone of Kaghan valley. If the road is constructed on new routes, there will be no chance of landslide occurrence on these routes.
See Map
|
| 4 |
Development for Model input using Visual Basic and Arc ViewContamination in USA
This part of ArcPRZM-3 was developed using Microsoft Visual Basic programming. The graphical user interfaces were developed so that inputs of the model can be easily entered. This part of the system is called Visual PRZM-3. The interfaces are tied to chemical, crop, and soil databases, which provide default, input values to users. The data, which is stored in a database, can be easily modified for updated simulations.
Visual PRZM-3 can be used to run single simulation for a site-specific study or multiple simulations for a regional area. The chemical and crop database was obtained from the values given in the PRZM-3 manual.
The soil input parameters were obtained from the Soil Survey Geographic Database (SSURGO). Fig. 4 shows the main interface for Visual PRZM-3.
The users can select the crop and chemical of their interest. In Fig. 5, we can see the Visual PRZM-3 input menu interface which shows the different main inputs of PRZM-3. Users can click each of these main inputs to go to interfaces of environmental proportion data, chemical data and crop data. In Visual PRZM-3 the user can choose to run a single simulation for site specific or to run batch processing for Fig 5 Visual PRIM-3 input menu interface regional area.
See Map
|
| 5 |
Development for Model output using GIS programming (Avenue) In Arc View
Two extensions were developed using avenue programming to present Visual PRZM-3 (Model input) results for following two scenarios:
<strong> Arcprzm3.avx </strong>
This extension was developed for scenarios when erosion values will be calculated in Visual PRZM3 simulation. The Digital Elevation Model (DEM) will be used to calculate slope values for the Universal Soil Loss Equation that is incorporated in the original PRZM-3 model. The slope values are extracted from each raster cell. In this case, users need to have soil and crop maps in raster form.
<strong>No Erosion-Arcprzm3.avx </strong>
This extension was developed for scenarios when erosion values will not be calculated in Visual PRZM-3 simulation. This analysis is based on vector maps of soil and crop. After loading any of the above extensions in an Arc View project. the user will be able to see new buttons as shown in the rectangle of Fig.6
Tools have been developed in ArcView that allow the user to process the text files produced by PRZM-3 and represent them in tables, chart, and maps. The user could choose to spatially represent a certain output parameter such as total amount of pesticide leached below the root zone at a certain time such as one year after application.
See Map
|
| 6 |
Land use of Woodruff County
This project was conducted to determine the applicability and efficiency of a coupled GIS simulation model system called ArcPRZM-3. The system was applied to and results were compared with DRASTIC model for Woodruff Country in the Arkansas Delta of USA. The land use map for Woodruff country was produced using satellite imagery Landsat TM for the year 1992 (Fig.11). The soil map for Woodruff Country was obtained from Soil Survey Geographic (SSURGO) Database.
The maximum dissolved bentazon concentration was observed at 75cm soil depth for two year using ArcPRZM-3. Based on ArcPRZM¬3 results, the health risk map was developed for the Woodruff county using US EPA Lifetime Health Advisory Level (LHA) of bentazon in drinking water. DRASTIC and ArcPRZM-3 were evaluated by comparing the results with bentazon detection data in monitoring wells. The comparison showed that 100% of the wells where bentazon was detected were within the health risk category based on ArcPRZM-3 predictions (Fig.12), whereas DRASTIC model showed 60% of those wells were within highly vulnerable areas.
See Map
|
| 7 |
Spatial dismbution for bentazon reaching at 75cm using ArcPRZM14-3 and associated health nsk with monitoring wails in 'Noodruff County
The ArcPRZM-3 performed better than DRASTIC in predicting the areas vulnerable to bentazon contamination. Furthermore, the ArcPRZM-3 quantified bentazon concentrations that helped link these concentrations to drinking water standards while DRASTIC only provided qualitative relative rankings. ArcPRZM-3 significantly facilitates spatial modeling of chemical leaching; therefore, our study suggests that using the coupled GIS-modeling system may enhance groundwater quality management.
See Map
|
| 8 |
Investigative Spatial Distribution and Modelling of Existing and Future Urban Land Changes and Its Impact on Urbanization and Economy
In Lahore, rapid economic growth has led to urbanization, which changed the usage of existing land and it also built pressure on the available resources. The increase in population, better economy, and proximity of inhabitants to basic facilities and resources are the potential factors for urban sprawl. It resulted in greater land utilization and disintegration of natural and man-made features. Due to all these factors, District Lahore was selected for studying the land cover change analysis. In this project, the tasks completed were to produce historical LULC maps during the 1988–2016 period for spatial and temporal analysis, forecast future LULC until 2040 by using the Markov model, and identify the impact of LULC on urbanization. Two scenes of Landsat-5 TM for 1988 and 2001 and one scene of Landsat-8 OLI for 2016 were processed and used. The Normalized Difference Vegetation Index (NDVI) model with precise class value ranges was applied to produce land cover maps with six classes of water, built-up, barren land, shrub and grassland, sparse vegetation, and dense vegetation. LULC maps for the years of 1988 and 2001 were used to develop an LULC transformation matrix. It was used to drive an LULC transformation probability matrix using a Markov model for future forecasting of LULC in 2014, 2027, and 2040.
See Map
|
| 9 |
Cauterization of Surface Water Quality and Its Relation to Climate and Land Use/Cover for Twelve Major Rivers of Alberta, Canada
The quality of waters in rivers and lakes depend on climate, land use, land cover, geographical and anthropogenic factors. Climatic factors, such as melting snow over high latitudes and precipitation wash material from the land surface into the water bodies. Various land use activities (e.g., wood logging, agricultural, mining and urban development) can be potential sources of pollutants, which impact the water quality. Thus, it is important to classify the raw surface water quality and study the spatio-temporal impacts due to anthropogenic activities and climatic factors.
In Alberta, 17 water quality-related parameters are periodically measured for 12 major rivers at 23 fixed sampling sites. These data are then analyzed using the Canadian Water Quality Index (CWQI) system developed by the Canadian Council of Ministers of the Environment (CCME); and represented as an index-value. Despite the robustness and acceptance of CWQI, the data acquisition is labour intensive, time consuming and costly. Thus, it is worthwhile to investigate whether a lesser number of water quality-related parameters would produce similar CWQI-values.
In this project following tasks were implemented (i) clusters for major rivers in Alberta were developed on the basis of monthly water quality data, (ii) Clusters using Canadian Water Quality Index (CWQI) system were evaluated, (iii) applied clusters for spatio-temporal analysis, and (iv) studied the impact of climatic factor (i.e., snow-melting) and land use activities on the water quality of the rivers.
See Map
|
| 10 |
Clustering Eighteen Lakes in Alberta on the basis of Water Quality Parameters
In this Project, 18 lakes in Alberta, Canada using the data of 19 water quality parameters for a period of 11 years (1988–2002) were clustered which consisted of (i) principal component analysis (PCA) to determine the dominant water quality parameters, (ii) cluster analysis techniques to develop the characteristics of the clusters, and (iii) pattern-match lakes to determine the appropriate cluster for each of the lakes. Five clusters for the period 1994–1997 were obtained by using the dominant parameters with water quality deteriorating as the cluster number increased from 1 to 5. Upon matching cluster patterns with the entire dataset, it was observed that some of the lakes belonged to the same cluster all the time (e.g., cluster 1 for lakes Elkwater, Gregg, and Jarvis; cluster 3 for Sturgeon; cluster 4 for Moonshine; and cluster 5 for Saskatoon), while others changed with time.
This methodology could be applied in other regions of the world to identify the most suitable source waters and prioritize their management. It could be helpful to analyze the natural controlling processes, pollution types, impact of seasonal changes and overall quality of source waters. This methodology could be used for monitoring water bodies in a cost effective and efficient way by sampling only a smaller number of dominant parameters instead of using a large set of parameters.
See Map
|
| 11 |
Development of Remote Sensing Based Models for Surface Water Quality of Bow River of Alberta, Canada
Water extends approximately 71% of earth’s surface and it is also imperative for the existence and sustainability of living organism on the earth surface. The freshwater is just 2.5% of the earth’s water. About 0.3% of freshwater is found in rivers, lakes and atmosphere. In general, the understanding of the water quality plays a critical role prior to utilize for various purposes including drinking. In this project, I opted to understand the surface water quality for the Bow River, which is a major river in the Canadian province of Alberta having a total length of 587 km, and a main source of drinking water for many communities of the province.
The surface water quality of the Bow River is measured every month at three fixed sampling sites (i.e., Cars eland, Cluny and Rona lane) for different water quality variables using the traditional methods. In general, these methods provide accurate measurements, however, these may not be feasible means to sample the entire river due to the huge involvement of labour and cost. Currently, the measured data of water quality variables at the sampling sites of the Bow River are grouped into five classes (i.e., excellent, good, fair, marginal and poor) using the framework of Canadian Water Quality Index. These classes are obtained on the basis of fixed-point locations, which does not represent the spatial dynamics of the entire river. The main purpose of project to develop remote sensing-based models for Canadian Water Quality Index and Turbidity classes for assessing both spatial and temporal dynamics of the Bow River. The services rendered in this project include:
(i) Development and evaluation of remote sensing-based models to acquire CWQI classes using the planetary reflectance of Landsat-5 TM and ground measured data
(ii) Development and evaluation remote sensing-based models to retrieve turbidity using the planetary reflectance of Landsat-5 TM and in-situ data
(iii) Application of the selected models to classify the source waters of the Bow River into CWQI and turbidity classes for spatial and temporal analysis
(iv) Identification of the impact of natural subregions on Bow River water quality
See Map
|
| 12 |
Development of Geospatial Database and GIS Based Analysis & Management System for Punjab Industries
This project was funded by World Bank. The purpose of this project was to develop a complete database of industries in GIS. We analyzed the most suitable locations for proposed industries in Punjab province. We also developed GIS based monitoring and evaluation system for industry sector. This project was completed through The Urban Unit. It is a major component of Punjab Spatial Strategy Project.
Major tasks completed were:
- Development of GIS maps for data related to industries located in 36 districts of Punjab
- Development of survey plans for collecting data related to industries in 36 districts of Punjab
- Development of GIS based analysis for industries
- Managing GIS professionals working in the capacities of Research Associates, GIS Analysts, RS professionals, and GIS Managers in for development of Geodatabase for industries of Punjab
See Map
|
| 13 |
Development of Geospatial Database and GIS Based Analysis & Management System for Punjab Roads
Connectivity is one of the major components of Punjab Spatial Strategy Project. This project was funded by World Bank. In this project we developed Geospatial databases and GIS based management system for roads of Punjab Province. We also accomplished road accessibility analysis for different services regarding population. This project was completed through The Urban Unit. It is a major component of Punjab Spatial Strategy Project.
Major tasks completed were:
- Development of GIS maps for data related to road network located in 36 districts of Punjab
- GIS analysis for road and transport data of Punjab
- Managing GIS professionals working in the capacities of Research Associates, GIS Analysts, RS professionals, and GIS Managers for development of geospatial database and GIS based analysis & management system for Punjab roads
See Map
|
| 14 |
Pesticide Health Risk Mapping and Sensitivity Analysis of Parameters in Groundwater Vulnerability Assessment
The extensive use of pesticides for increasing the agricultural production is affecting the quality of groundwater. Major tasks completed in this project were:
i. Development of pesticide relative leaching ranks for well sites
ii. Development of maps for human health risks due to pesticide applications
iii. Identifying the most significant parameters in pesticide simulations for ground water vulnerability assessment
The methods adopted for this project are:
i. Development of acifluorfen relative leaching ranks for 25 well sites using ArcPRZM-3
ii. Development of health risk maps using model simulated maximum dissolved bentazon concentrations on the basis of USA drinking water quality guidelines
iii. Sensitivity analysis for 14 ArcPRZM-3 input parameters using the Placket–Burman method
ArcPRZM-3 is a user-friendly system for spatial modeling of pesticide leaching from surface to groundwater. This system could be efficiently applied for spatial modeling and mapping of pesticide concentrations for groundwater vulnerability assessment on a large scale.
See Map
|
| 15 |
Land Cover Change Analysis for 36 Districts of Punjab Using Remote Sensing
This project was funded by World Bank. In this project we analysed the temporal changes in Punjab province. We calculated land cover changes in last 25 years. Different land cover classes such as agriculture, water bodies, barren land and built-up were estimated. This project was completed through The Urban Unit. It is a major component of Punjab Spatial Strategy Project.
The major tasks of this project were to develop land cover classification maps and analyze land cover change analysis for 36 districts of Punjab using satellite imageries.
The outcome of this project was to determine the changes in built-up, water bodies, and vegetation in the last twenty years. This will help to develop planning strategies for each district of Punjab.
Major steps taken in this project were:
• Satellite image downloading (Landsat-5 & Landsat-8)
• Satellite image pre-processing
• GPS based field survey for land cover classes signatures
• Satellite image post-processing
• Land cover classification
• Land cover change analysis
• Managing GIS professionals working in the capacities of Research Associates, GIS Analysts, RS professionals, and GIS Managers for land cover mapping and land cover change analysis for 36 districts of Punjab
See Map
|
| 16 |
Multi-Hazard Vulnerability Risk Assessment for Twenty Districts of Punjab– PAK: Flood Emergency Reconstruction and Resilience Project (FERRP)
The prime objective of the project was to consolidate hazard, exposure/vulnerability and capacity assessment results through qualitative and quantitative techniques to derive composite integrated Multi Hazard Vulnerability and Risk Assessment picture of the study area. The work was proposed for following twenty districts in three phases.
Phase 1: Sialkot, Muzaffargarh, Layyah, Hafizabad, Jhang
Phase 2: Khushab, Bhakkar, D.G. Khan, Multan, Mianwali, Rajanpur, Rahim yar Khan
Phase 3: Narowal, Sargodha, Mandi Bahauddin, Kasur, Gujrat, Gujranwala, Chiniot, Jhelum
Following tasks were accomplished during the project:
Preparation of GIS based historical disaster damage catalogues for 20 districts of Punjab at union council level
1. Disaster damages of human lives, crops, livestock
2. Disaster damages of road & building infrastructures
3. Disaster damages of parks, industries & epidemics
Exposure and vulnerability assessment using GIS & modelling for 20 districts of Punjab at union council level
1. Development of methodology & models
2. Disaster vulnerability assessment modelling & mapping
3. Socio-economic vulnerability assessment modelling & mapping
4. Exposure & vulnerability assessment reports
Multi-hazard vulnerability risk assessment using GIS & modelling for 20 Districts of Punjab at union council level
1. Development of methodology & models
2. Flood risk assessment modelling & mapping
3. Earthquake risk assessment modelling & mapping
4. Drought risk assessment modelling & mapping
5. Multi-hazard vulnerability risk assessment modelling & mapping
6. Multi-hazard vulnerability risk assessment reports
Institutional capacity assessment for disaster risk management in five departments of 20 districts of Punjab
1. Capacity assessment for District Disaster
management Authority, Civil Defence, Rescue 1122, Education Department & Health Department
2. Development of methodology & models
3. Development of capacity assessment forms
4. Quantitative analysis of capacity
5. Qualitative analysis of capacity
6. Institutional capacity assessment report
See Map
|
| 17 |
Simulating Current and Future River-Flows in the Karakoram and Himalayan Regions of Pakistan Using Snowmelt-Runoff Model and RCP Scenario
The change in climate patterns is one of the major challenges that the world is confronting today, especially due to its diverse and uncertain impacts on water resources. Anthropogenic warming has caused the retreat of glaciers worldwide since the industrial revolution. Upper Indus Basin (UIB)supplies more than 70% flow to the downstream agricultural areas during summer due to the melting of snow and glacial ice. Snow cover is one of the most significant variables that can be accustomed to water resource management. In this project, two types of data sets were used to simulate the stream flow using SRM in the Astore and Hunza basins. These datasets consist of remotely sensed satellite data, including DEM and snow cover maps, and the field observation records consisting of hydro-metrological variables such as mean, temperature, precipitation and stream flows. Two types of remote sensing data were used: (a) DEM data of Advanced Land Observation Satellite (ALOS); and (b) MODIS (MOD10A2) snow product. The main focus of this project was on the simulation of snowmelt-runoff using Snowmelt-Runoff Model (SRM) under the current and future Representative Concentration Pathways climate scenarios in the two main tributaries of the UIB namely the Astore and Hunza river basins. Basin-wide and zone-wise approaches were used in the SRM. Zonal snow cover was estimated for each zone by reclassifying the MODIS snow maps according to the zonal boundaries. SRM was calibrated over 2000–2001 and validated over the 2002–2004 data period. The results implied from this project suggested that the water resources of Pakistan should be managed properly to lessen the damage to human lives, agriculture, and economy posed by expected future floods as indicated by the climatic projections.
See Map
|
| 18 |
GIS for Land Use and Water Distribution Network - Sindh Cities Improvement Program (SCIP) of North Sindh Urban Services Corporation
Sindh Cities Improvement Investment Program (SCIP) is ADB assisted US$ 400 million infrastructure and service delivery reform program. The aim of this project was to improve water supply, wastewater management, and solid waste management (SWM) services in participating 20 secondary cities through establishment of government-owned, professionally managed Urban Services Corporations; urban sector reforms and investment in water supply, wastewater and solid waste management infrastructure.
Following maps were developed during the project:
i. Land use Map - Sukkur City
ii. Land use Map - Khairpur City
iii. Land use Map - Rohri City
iv. Land use map with DNI zone - 1 & 2- Sukkur City
v. Land use map with DNI zone - 1 & 2- Khairpur City
vi. Land use map with DNI zone - 1 & 2- Rohri City
vii. Water Supply Distribution Network Improvement- Zone-1 & 2- Sukkur City
viii. Water Supply Distribution Network Improvement- Zone-1 - Khairpur City
ix. Water Supply Distribution Network Improvement- Zone-2 - Khairpur City
x. Water Supply Distribution Network Improvement- Zone-1 - Rohri City
xi. Water Supply Distribution Network Improvement- Zone-2 - Rohri City
|
| 19 |
MIS/GIS Survey and System for Saaf Paani Project of Punjab
The Government of Punjab has endeavored to develop a program to improve water supply in terms of, both, access and quality of drinking water, especially in unserved and underserved areas i.e. rural and peri-urban areas of the province. The Government of Punjab has established the Punjab Saaf Pani Company (PSPC) with a mandate to develop, design, plan and execute projects for providing safe drinking water solutions, prioritizing underserved areas, especially in rural and peri-urban areas of the province. The purpose of this project was to develop GIS-MIS based system for monitoring the progress of saaf pani project.
Following tasks were completed during the project:
i. Saaf Pani Mapping Module
ii. Monitoring Module- Achievement Dashboard
iii. Asset Management Information System
iv. Complaint Management System
v. Mapping and Survey of Settlement and Survey / Updating
vi. Content Management System
vii. Design and Procurement of Control Room and Infrastructure System
viii. Social Appraisal dashboard and application
|
| 20 |
Landslide Hazard Modelling and Investigation
The landslide hazard is one of the most damaging natural hazards in mountains which cause potential risks to population in terms of damages to properties, transports and structures. In this project, the main purpose was to investigate the impact of influential factors for landslide hazard occurrence and model the landslide hazard for District Muzaffarabad of Azad Jammu & Kashmir located in Northern Pakistan. The seven influential factors were considered for landslide occurrence which are land cover, rainfall, elevation, slope, slope aspect, distance from main road and distance from drainage network. The tasks completed during this project were:
(i) Development of landslide and land cover map using high resolution satellite images of Google Earth
(ii) Extraction of elevation, slope and slope aspect map from NASA SRTM data
(iii) Preparation of rainfall map from monthly rainfall data
(iv) Preparation of drainage and road maps
(v) Generation of classes for maps of landslide influential factors
(vi) Investigation of impact of influential factors on landslide
(vii) Assignment of weights to all classes of influential factors on the basis of output calculated in no. (vi)
(viii) Development of landslide hazard zone map and its accuracy assessment
The landslide hazard map which was finally developed by overlaying other maps of other factors could be utilized for planning, construction, maintenance and management of roads and other structures in the study area.
See Map
|
| 21 |
GIS Based Urban Land Change Analysis
The urban land of Abbottabad city is constantly changing due to population growth and migration of people from other regions. It causes major problems of depletion of natural land resources. The main aim of this project was to study the urban land change in the past 17 years.
The major tasks completed during this project were:
i. Acquisition of satellite images from Google Earth
ii. Digitization of land covers classes for both years of 2001 and 2018 using the satellite images
iii. GIS analysis for quantifying the land cover changes.
Types of LULC areas were categorized into different classes on the basis of using land resources.
i. Built up area
ii. Open land/free land
iii. Crop land/vegetation area
iv. Forestation
v. Barren land
vi. Recreational area
This can be utilized for future urban planning development and management of urban land of district Abbottabad.
See Map
|
| 22 |
Geographic Information System for Spatial Data Infrastructure Management System
The Governments of Punjab (GoPB) and Khyber Pakhtunkhwa (GoKP) have implemented the Sub-National Governance (SNG) Programme from April 2013 to September 2017 with finance and technical support provided by the UK Department for International Development (DFID).
This programme aims to deliver results across three areas:
• Decisions by subnational governments are based on robust evidence
• Subnational government services are more responsive to people’s needs
• Strengthened subnational government capability to deliver basic services
In order to achieve these objectives, the SNG programme seeks, among other things, to support the establishment of District GIS Cells to enhance the adoption of evidence-based decision-making processes at provincial and district levels. After successful piloting in four SNG districts, GIS was rolled out to the remaining eight SNG districts to provide advanced software tools and applications for data analysis initially in the education and health sectors of selected pilot districts, primarily through the use of existing datasets. Provincial Steering Committees in Punjab and Khyber Pakhtunkhwa have approved the introduction of district-level GIS (completed for the 4 initial SNG pilot districts), and the rollout of GIS to the eight remaining SNG districts.
The additional SNG districts are as follows:
• KP: Buner, Dera Ismail Khan, Lakki Marwat, Nowshera
• Punjab: Bahawalnagar, Hafizabad, Mandi Bahauddin, Sahiwal.
In this project, GIS implementation plan was prepared that specifies the organizational and human resource requirements required to implement GIS at district level, including hardware and software technical requirements, data collection requirements (map digitization and geo-referenced school and health facility data), GIS data management requirements, capacity building requirements such as training programmes for education and health mapping and planning and other GIS related training, and GIS work outputs related to monitoring and planning.
|
| 23 |
Pedestrian environment and behavior in Lahore, Pakistan
Road safety literature agrees that pedestrian’s safe mobility is associated with human behaviours, general or situational factors, connected with infrastructures. In Pakistan, a high proportion of pedestrians’ deaths in road crashes are attributed to bad road etiquette including drivers not giving right of way to pedestrians, inadequate pedestrian walkways, lack of traffic control on many intra-city intersections, encroachment of sidewalks due to commercial activities and placement of garbage and garbage collection containers. It is argued that not only pedestrians’ mobility recognition is overlooked in the country, but when provided, pedestrians do not make appropriate use of pedestrian facilities. Eight different intersections were selected based on different land-uses of their neighborhoods in Lahore.
The main objectives of this project were to investigate:
i. Comparison of side-walking and road-crossing behaviors with respect to gender, age group, land-use of neighborhoods, and the presence of traffic signal at an intersection
ii. Comparison of behavior of drivers with respect to gender, age group and the presence of traffic signal at an intersection
For this purpose, 1040 pedestrians and 974 drivers were observed through video recordings at eight different intersections and differences in side walking and road-crossing behavior was investigated based on their gender, age group, land-use characteristics of the neighborhood and according to the presence of traffic signal at the intersection. Driver behavior with respect to pedestrians was also investigated for the same factors excluding land-use characteristics of the neighborhood.
See Map
|
| 24 |
Remote Sensing-Based quantification of the Relationships between Land use Land cover changes and Surface Temperature over the Lower Himalayan Region
The land use land cover (LULC) changes have become a source of concern because of its role in reducing biodiversity and altering regional climate and creating an urban heat island (UHI) in cities. Population growth and population inflow from other regions has caused urbanization which altered land use land cover (LULC) in the lower Himalayan regions of Pakistan.
This change increased the land surface temperature in the region.
The main objectives of this project were to:
i. Assess LULC and LST changes for the period of 1990-2017 using Landsat data
ii. Simulation of LULC changes for the period of 2032 and 2047 using transition potential matrix obtained from the data years of 2002 and 2017
iii. Validating accuracy of CA-ANN model using simulated and classified images of 2017 with correctness values of 70% using validation modules in QGIS
iv. LST acquired for this period was then modeled for 2032 and 2047 using urban indices
(UI) and linear regression analysis
See Map
|
| 25 |
Application of GIS & Remote Sensing for Land Use Planning in North West Frontier Province of Pakistan
This project was funded by DHV Consultants, Netherlands. In this project we have designed land use planning methodology by using GIS & Remote Sensing Technology in the North-West Frontier Province (NWFP) of Pakistan.
|
| 26 |
Application of GIS & Remote Sensing for NWFP Department of Forestry, Fisheries and Wild Life
This project was funded by Asian Development Bank. In this project we have designed methodology for using GIS and Remote Sensing for the North-West Frontier Province (NWFP) Department of Forestry, Fisheries and Wildlife.
|
| 27 |
Afforestation Survey Using GPS
This project was funded by GTZ, Germany. We have conducted surveys using Global Positioning System (GPS) for plantation, villages and roads. We have downloaded, complied and processed data using GPS (Garmin Survey II) software. We have developed final maps using Auto-Cad software.
|
| 28 |
Plantation Survey Project Using GPS
This project was funded by Agrar-Und-Hydro Technik (AHT). Germany. The work included surveying the plantation area of Tarbella Watershed Management Project using Global Positioning System (GPS) to produce topographic maps of scale 1: 10000.
|


